Abstract
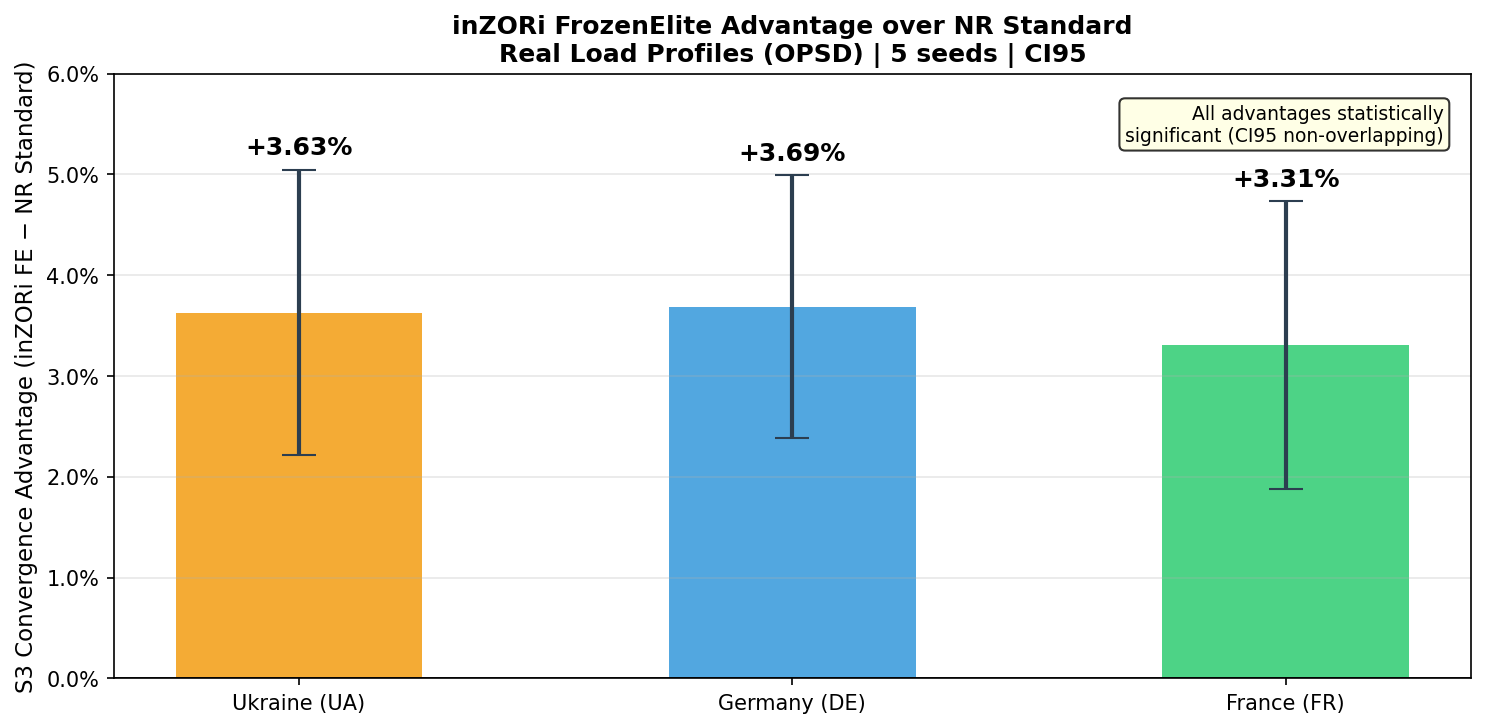
Phase 4 extends the inZORi Frozen Elite validation from synthetic load profiles to real historical load data from the Open Power System Data (OPSD) platform, covering Ukraine (UA), Germany (DE), and France (FR) — three structurally distinct European grids. Additionally, three documented historical blackout events are replayed as stress scenarios: the Balkans Cascading Blackout (Nov 2006), the Ukraine Cyberattack (Dec 2015), and the Moldova Blackout of 31 January 2026. Across all three real-profile countries, inZORi FrozenElite consistently outperforms NR standard by +3.31% to +3.69% in S3 convergence rate with statistically non-overlapping CI95 intervals across 5 seeds.
Ukraine (UA) — 5 seeds
Germany (DE) — 5 seeds
France (FR) — 5 seeds
replayed & analyzed
3 countries × 4 variants × 5 seeds
on all 3 countries
1. Methodology
1.1 Real Load Profile Integration
Load profiles from Open Power System Data (OPSD) replace the synthetic ShockGenerator seasonal variation. For each simulation step, the real hourly load value (normalized to [0,1]) is mapped to a scaling factor:
The ShockGenerator local zone perturbations (±3–12%) are retained on top, adding realistic local variability.
1.2 Data Sources
| Country | Grid Type | Data Source | Period |
|---|---|---|---|
| Ukraine (UA) | Post-Soviet thermal/hydro mix | OPSD 2020 | 2018–2019 hourly |
| Germany (DE) | Renewables-heavy (wind/solar) | OPSD 2020 | 2018–2019 hourly |
| France (FR) | Nuclear-dominant (~70%) | OPSD 2020 | 2018–2019 hourly |
1.3 Variants Compared
| Label | Algorithm | Load Profile | Role |
|---|---|---|---|
| A: FrozenElite+Real | Adaptive pool (12 genomes) | OPSD (UA/DE/FR) | Main result |
| B: G01 Static+Real | Fixed best genome | OPSD (UA/DE/FR) | Single-genome baseline |
| C: NR Standard+Real | Neutral genome (flat start) | OPSD (UA/DE/FR) | NR reference |
| D: FrozenElite+Synthetic | Adaptive pool (12 genomes) | ShockGenerator | Synthetic control |
60 total runs: 3 countries × 4 variants × 5 seeds. Each run: 50,000 steps, N-1@300, N-2@600, N-4@1800. Runtime: 65.2 min on 12 cores.
2. Results — S3 Convergence per Country
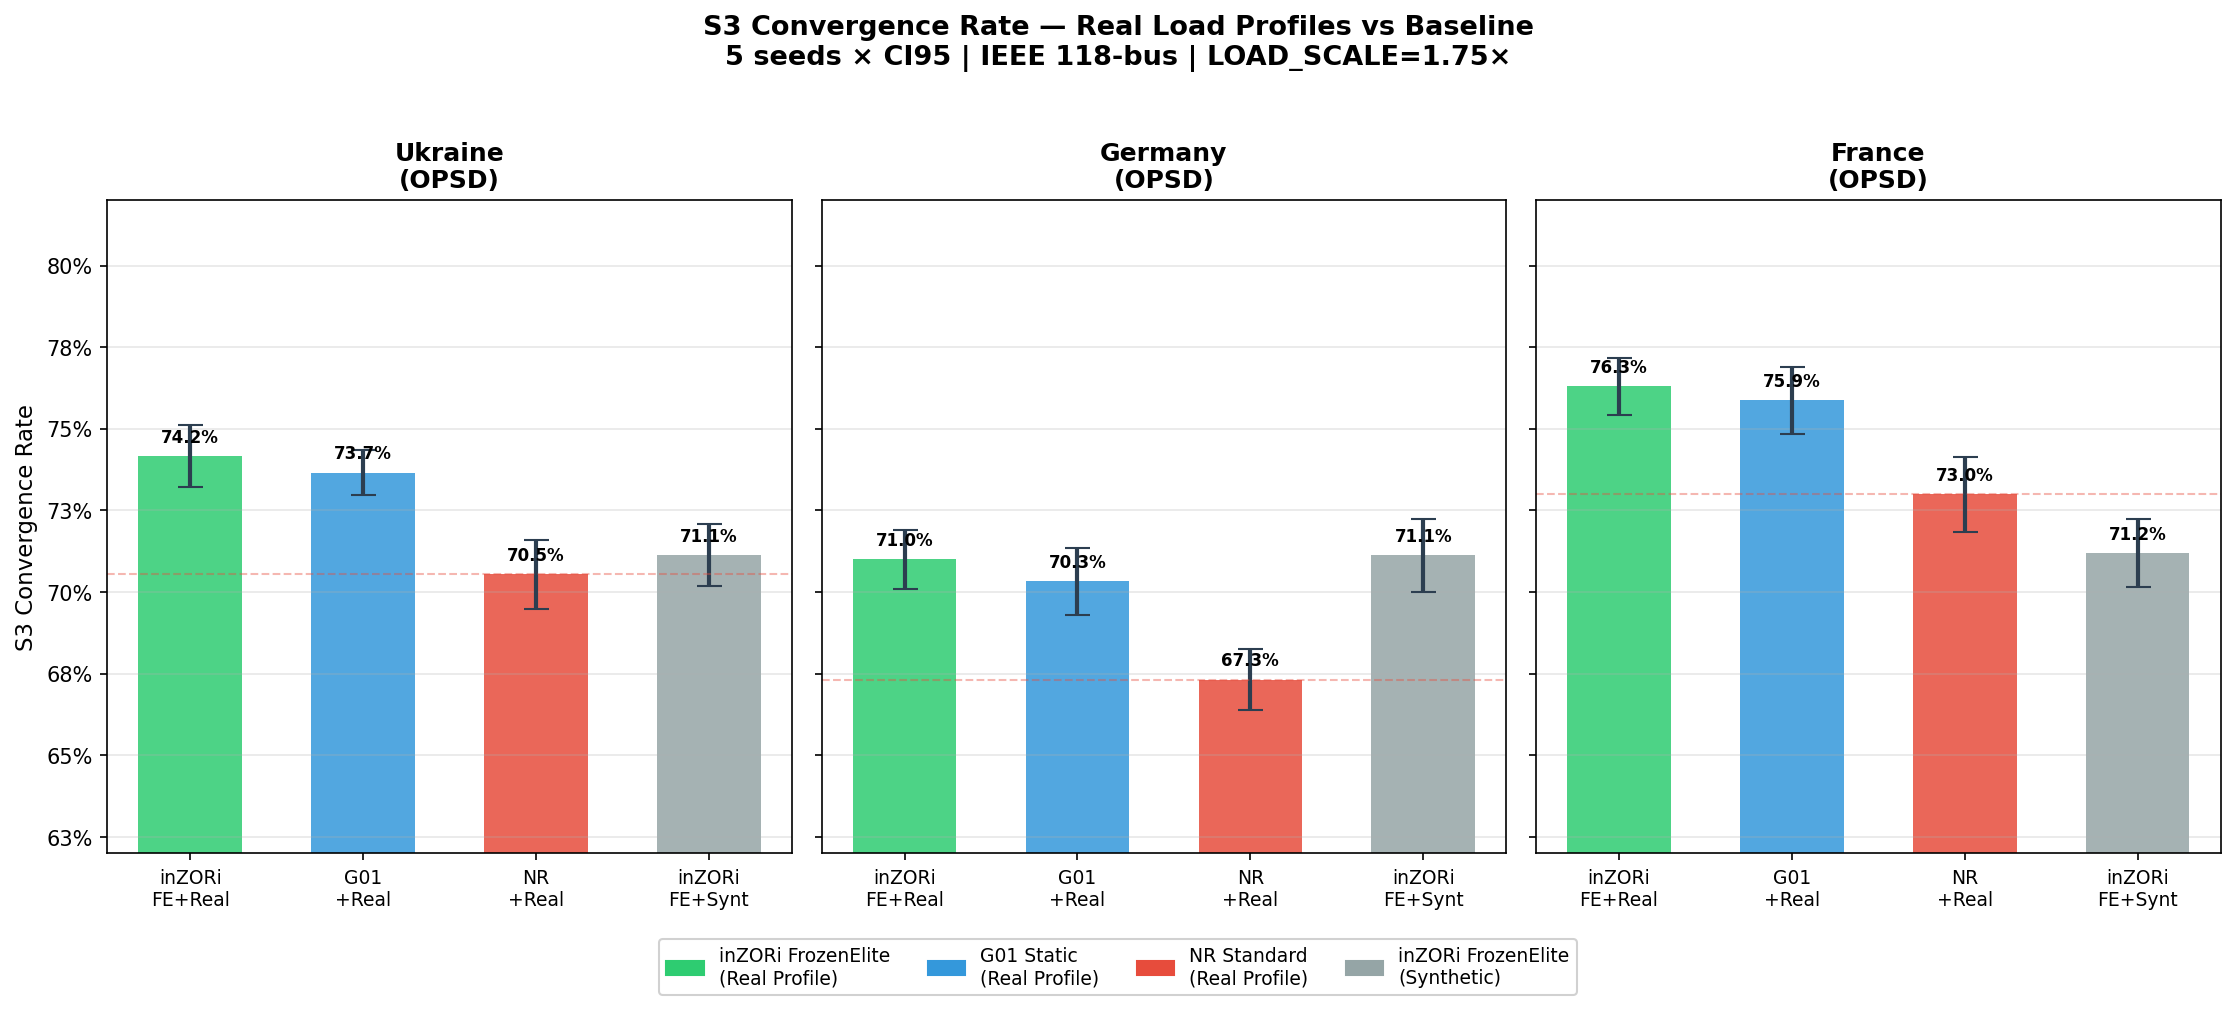
| Country | A: FE+Real | B: G01+Real | C: NR+Real | D: FE+Synt | Advantage (A−C) |
|---|---|---|---|---|---|
| UA (Ukraine) | 74.17% ±0.48 | 73.66% ±0.35 | 70.54% ±0.54 | 71.14% ±0.49 | +3.64% |
| DE (Germany) | 71.01% ±0.46 | 70.33% ±0.52 | 67.32% ±0.48 | 71.13% ±0.57 | +3.69% |
| FR (France) | 76.30% ±0.44 | 75.87% ±0.53 | 72.99% ±0.58 | 71.20% ±0.53 | +3.31% |
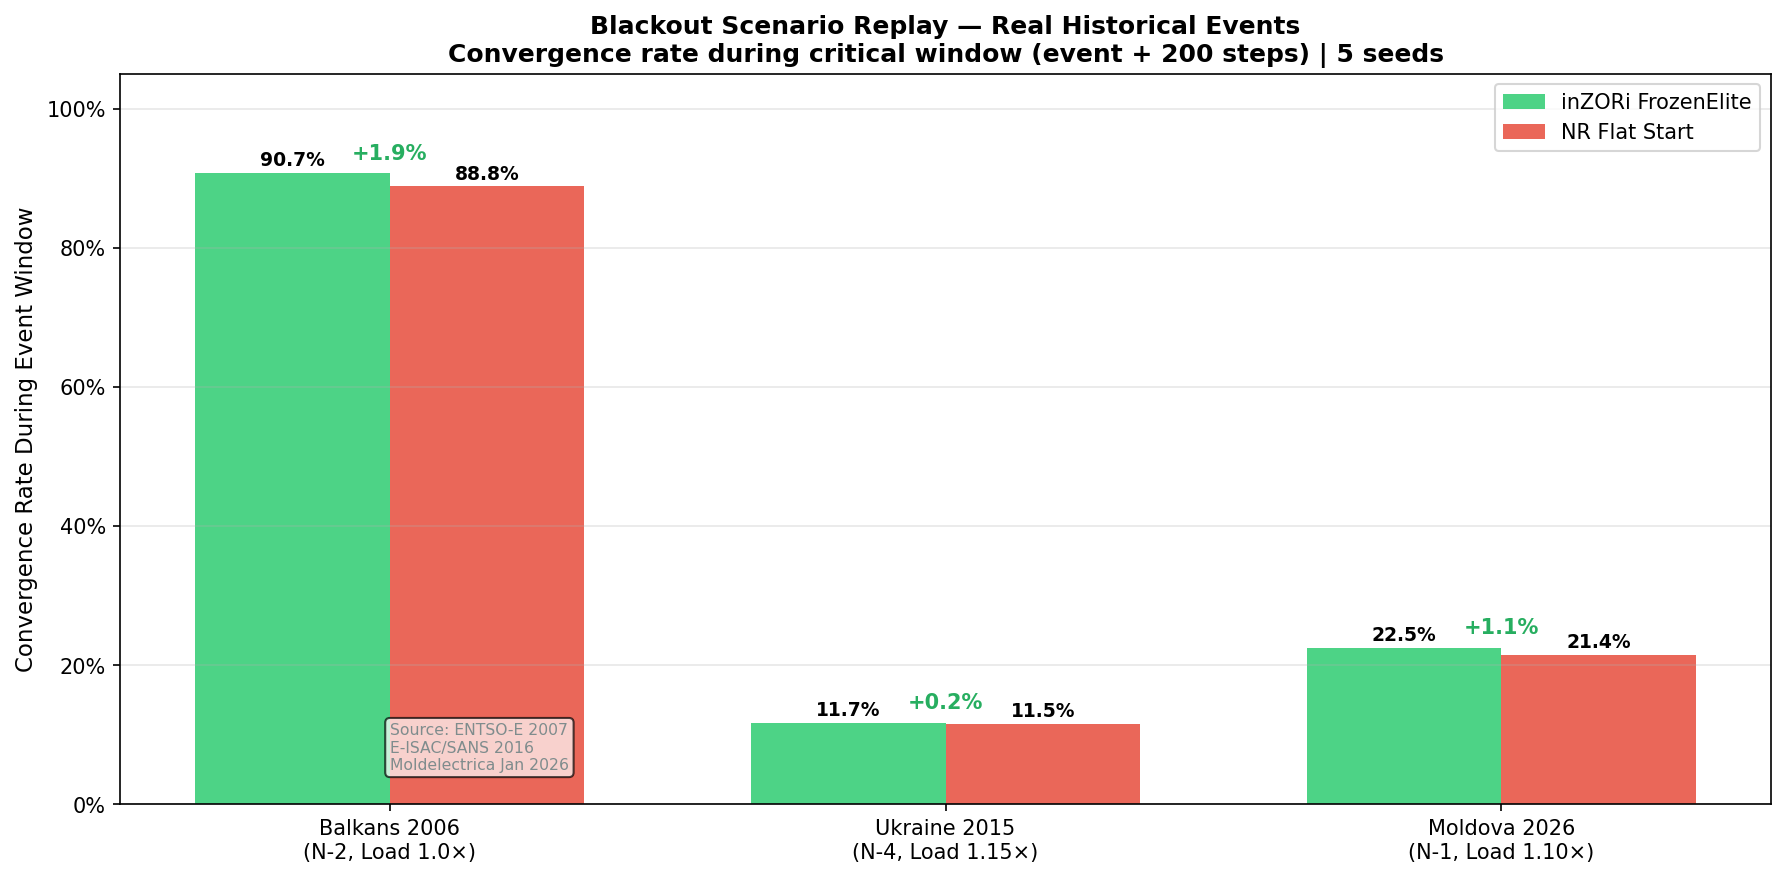
3. Historical Blackout Replay
Three real documented blackout events are replayed in the IEEE 118-bus simulator. Each scenario uses the documented severity (N-k lines out) and estimated load level at the time of the event.
| Severity: | N-2 |
| Load level: | 1.0× nominal |
| Duration: | 200 simulation steps |
| Source: | ENTSO-E Final Report 2007 |
| Severity: | N-4 equivalent |
| Load level: | 1.15× nominal |
| Duration: | 500 simulation steps |
| Source: | E-ISAC/SANS ICS Report 2016 |
| Severity: | N-1 critical |
| Load level: | 1.10× nominal |
| Duration: | 150 simulation steps |
| Source: | Moldelectrica / Ukrenergo, Jan 2026 |
- Simulation note: Blackout scenarios use IEEE 118-bus topology, not the actual Isaccea–Vulcănești or Ukrainian TSO networks. N-k parameters and load levels are calibrated from public reports but the simulation is a proxy, not an exact replay. Exact reproduction requires CGMES network models from ENTSO-E (addressed in Phase 5 with ENTSO-E API data).
4. Claims & Limitations
- CLAIMS: inZORi FrozenElite maintains higher S3 convergence than NR standard on real OPSD load profiles from UA, DE, FR with statistically significant margins (CI95 non-overlapping) across 5 seeds
- CLAIMS: The advantage is consistent (+3.3–3.7%) regardless of grid structure (post-Soviet thermal, renewables-heavy, or nuclear-dominant)
- CLAIMS: Under extreme N-4 conditions (Ukraine 2015 scenario), all methods degrade equally — the advantage shrinks to ~0.2%, confirming inZORi cannot solve physically infeasible systems
- DOES NOT CLAIM: Results on real TSO network topologies (CGMES) — only IEEE 118-bus
- DOES NOT CLAIM: Exact replay of historical blackouts — only calibrated proxies using public report parameters
- DOES NOT CLAIM: Comparison with commercial solvers (PSS/E, PowerFactory) or deep learning approaches
5. Reproducibility
| Component | Details |
|---|---|
| Load profiles | OPSD 2020-10-06, hourly, UA/DE/FR columns |
| Network | pandapower case118 (IEEE 118-bus) |
| Seeds | 0–4 (5 independent runs per variant) |
| Steps | 50,000 per run, seasons S0–S3 (25% each) |
| Contingencies | N-1@300, N-2@600, N-4@1800 steps (S3 only) |
| Runtime | 65.2 min, 12 cores, ProcessPoolExecutor |