Abstract
A 2D world with autonomous inZORi organisms is run under three population density regimes — LOW (20 initial organisms), MEDIUM (60), and HIGH (140) — across 24 seeds × 800 steps each. The study measures how density affects emergent collective behaviors: mortality, spatial distribution, clustering, genome diversity, and energy stability. No social rules are programmed — all effects emerge from organism interactions through shared environmental resources. Statistical analysis (t-tests, 95% CI) confirms significant density effects on mortality (p<0.0001), spatial spread (p=0.0002), and clustering (p=0.003).
1. Experimental Setup
Density Regimes
What is Being Measured
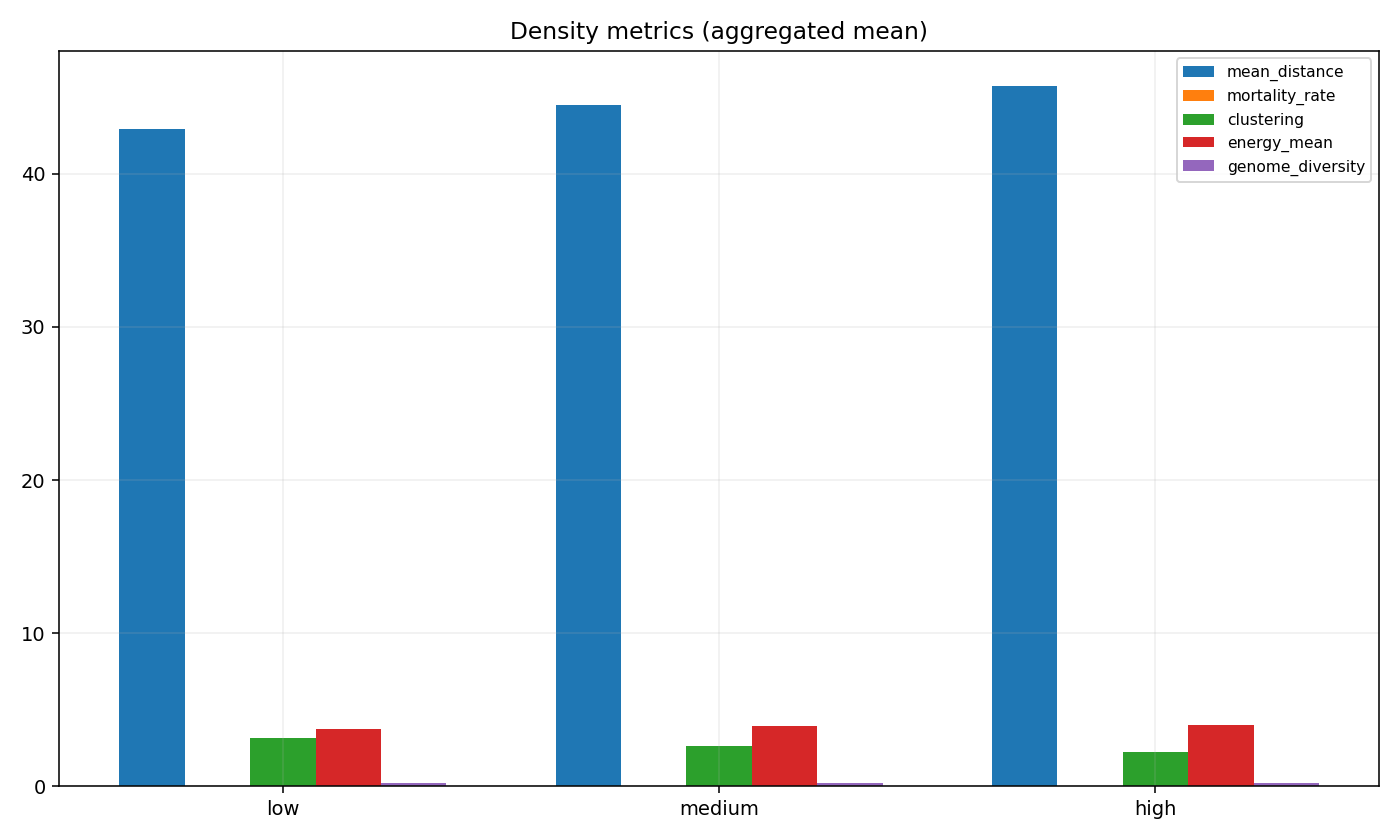
- Mortality rate: fraction of organisms that die per step (energy depletion)
- Mean distance: average distance between organisms — measures spatial spread
- Clustering: mean number of neighbors within a local radius — measures cohesion
- Genome diversity: variance in genome values across population — measures evolutionary diversity
- Energy mean: average stored energy per organism — measures resource health
2. Results
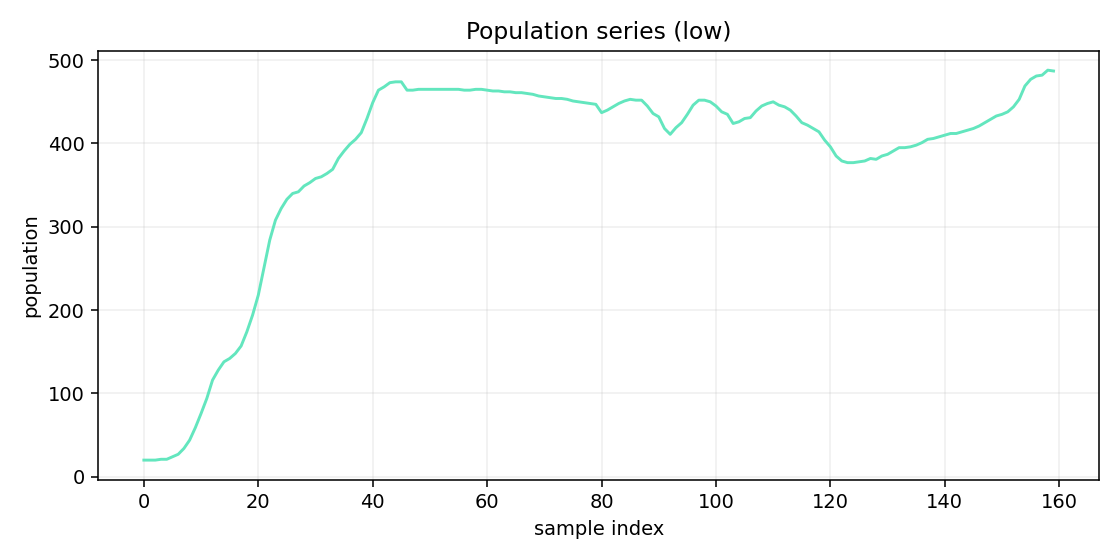
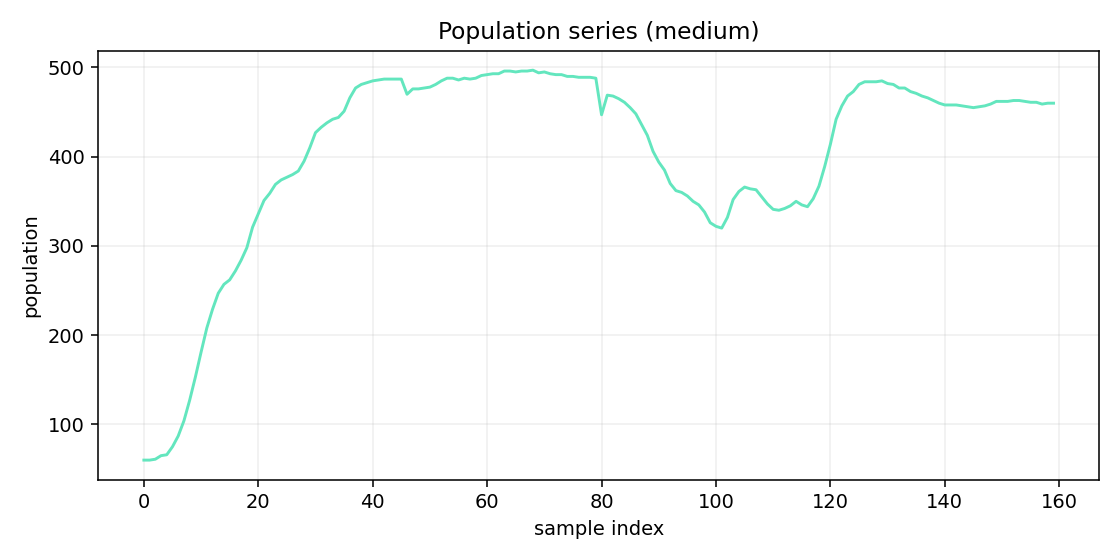
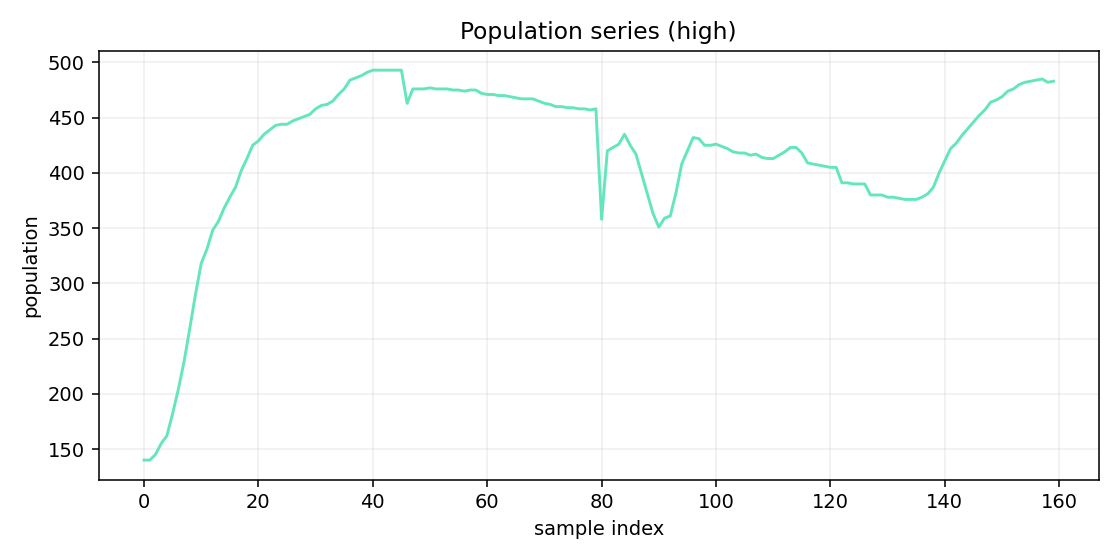
Live Visualization
Real-time organism movement under each density regime (GIF animations, 24-seed mean behavior):


Statistical Results
| Metric | LOW (95% CI) | HIGH (95% CI) | t-stat | p-value | Significance |
|---|---|---|---|---|---|
| Mortality rate | 0.00181 [0.00173, 0.00189] | 0.00338 [0.00325, 0.00351] | −20.5 | <0.0001 | p<0.0001 |
| Mean distance | 37.6 [35.5, 39.7] | 42.8 [41.1, 44.5] | −3.76 | 0.00017 | p=0.0002 |
| Clustering | 3.71 [3.28, 4.13] | 2.86 [2.51, 3.21] | 3.02 | 0.0025 | p=0.003 |
| Genome diversity | 0.222 [0.219, 0.224] | 0.211 [0.210, 0.212] | 7.37 | <0.0001 | p<0.0001 |
| Energy mean | 3.95 | 4.39 | — | — | Not sig. (stable) |
3. Key Findings
- Mortality +87% (LOW → HIGH): crowding creates resource competition that the genome cannot fully compensate through behavioral adaptation alone.
- Mean distance +13.7%: at high density, organisms spontaneously spread out — an emergent avoidance behavior reducing local resource competition.
- Clustering −22.9%: less spatial cohesion at high density — crowding pressure overrides the natural tendency to cluster near resource-rich zones.
- Genome diversity decreases at high density (0.222 → 0.211, p<0.0001): stronger selection pressure under competition reduces genome variation — selection is more intense when resources are scarce per capita.
- Energy remains stable despite density differences: organisms compensate at the individual level through behavioral adjustments, even if population-level mortality increases.
- Critical threshold between MEDIUM and HIGH: the mortality slope steepens significantly at the HIGH regime transition, suggesting a nonlinear density effect above ~60 organisms.
- Final population converges (~386–392 across all regimes): regardless of initial density, inZORi populations reach similar carrying capacity by step 800.
4. What This Demonstrates
Density-Dependent Emergent Behavior
This study demonstrates that inZORi populations exhibit density-dependent emergent behaviors analogous to those observed in biological ecosystems: increased mortality, spatial dispersal, reduced clustering, and narrowed genome diversity under high population pressure. None of these responses were programmed — they emerge from the interaction between organism survival drives and shared environmental resource constraints.
The finding that genome diversity decreases under high density is particularly significant: it mirrors the evolutionary dynamics of bottleneck populations, where intense competition acts as a strong filter on genetic variation. This is the same mechanism responsible for reduced biodiversity in overcrowded natural habitats.
The stable energy mean across densities suggests that individual organisms successfully adapt their foraging strategy to their local conditions, even when population-level mortality increases. This decoupling between individual adaptation and population-level pressure is a hallmark of robust emergent systems.
Applications: Urban planning (resource allocation under population density), ecological modeling, distributed robotic swarms, epidemiology (density-dependent disease transmission analogs).
5. Reproducibility
Framework: inZORi v1.0 | Domain: Social dynamics / emergent collective behavior
Runs: 24 seeds × 3 density regimes × 800 steps = 72 total runs
Density regimes: LOW (initial 20), MEDIUM (initial 60), HIGH (initial 140)
Statistical tests: Two-sample t-tests (Welch) with 95% CI; all reported p-values are two-tailed
Metrics: Mortality rate, mean inter-organism distance, clustering coefficient, genome diversity (variance), energy mean
Note: inZORi genome structure and selection mechanics are proprietary. Environmental setup (2D continuous world, shared resources) and all reported metrics are fully disclosed.